Diagnostic Analytics is the second part of our Analytics series. This form of analysis requires as a basis the model parameters object, dimension, value and event, which are explained in the article What is Descriptive Analytics. This allows a structured and flexible view of historical data.
This data contains situations that are recurring and should either be avoided or encouraged. The next step is to identify the causes and then set up a notification in the analysis solution using a combination of dimensions, objects, values and events. This is followed by the identification of measures available to the company to avoid or reinforce these situations. A simple example where this process has already been implemented is a fully automatic coffee maker: Even without sensors, after a certain number of draws, the machine requests that the grounds container be emptied, as it is highly likely that it is well filled. In such machines, the diagnostic as well as the predictive analysis is already completed in miniature and the conditions to be avoided are provided with clear instructions for action.
A diagnostic analysis process using the example of a coffee machine could, therefore, look as follows: The machine has a water container with a level sensor, a container for the filter with coffee, a button and a jug. After the machine has been put into operation, everything works perfectly, but at some point, the machine stops dispensing coffee. The reasons for this have not yet been identified and cannot be put into perspective.
In order to go through the process of diagnostic analysis, in the example of the coffee machine, the initial state has to be established repeatedly and every system state has to be observed. After a certain amount of these runs, a database is created from which conclusions can be drawn: The diagnostic analysis will detect a probable correlation between the filling level of the water container (empty) and the occurrence of the “No coffee” event.
Fortunately, in modern fully automatic machines this has already been done, including the next phases:
- ‘Predictive Analytics’: When the water is empty, there will probably be no more coffee
- ‘Prescriptive Analytics’: The machine gives the suggestion: Fill up with water.
What can be quickly analyzed and converted into a functional process in a fully automatic coffee maker with a manageable number of states is much more difficult in intralogistics: Many interfaces to other systems and companies mean that too simple a diagnosis and the measures derived from it can lead to problems elsewhere.
A simplified example of ‘Diagnosic Analytics’ from logistics
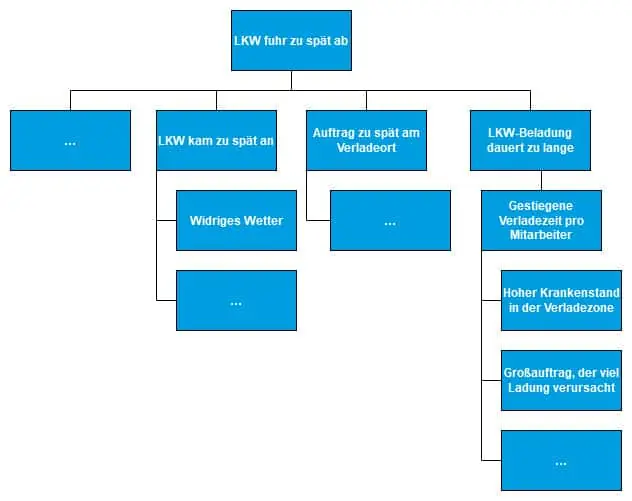
With the help of statistical data from the descriptive analysis, it was determined for an example warehouse that the departure time of the trucks with the goods to be shipped is a good indicator of the quality of service: If the truck departs on time, the goods are delivered to the customer on time and customer satisfaction is guaranteed. If there is a delay in departure, the customer receives the goods too late, which can lead to a loss of satisfaction. Diagnostic Analytics helps to embed processes in the right context: From time to time, there are outliers in the departure time. Yesterday, for example, a truck did not actually leave until 30 minutes after its scheduled departure time. The analysis process helps to find possible causes for these outliers. Various data (sources) are consulted
Here, possible explanations can be found using the drill-down method presented in the article on ‘Descriptive Analytics’:
• The truck already arrived too late
• The driver had to wait for an order, which arrived too late at the loading site
• The truck arrived on time and the goods were at the loading site on time, but the loading time was too long
• …
Let’s continue with the two exemplary strands: The adverse weather and the too-long loading time. There seems to be a connection between the bad weather and the late departure time. Also between the KPIs of cargo to be loaded per employee and departure time. What must be taken into account is that it is not possible to find an absolute explanation but rather a probability that this or that could be the trigger. However, other factors from possibly not considered data sources or a combination of factors could also play a role.
The role of ‘data analyst’ in analytics processes
Before the advent of machine learning methods, a data analyst had to find the answers to the situations that arose by manually examining various data sources for anomalies, patterns, and correlations, as we did with the two simple examples of the coffee machine and the late delivery. Today the analysts support different methods and algorithms from data mining processes to cope with the ever-increasing amount of data and to find those anomalies, patterns and correlations. In spite of machine support, a lot of expertise is still required, both in configuring, creating and selecting the data sources and algorithms and in evaluating the results found.
Survivorship bias and other traps in diagnostic analysis
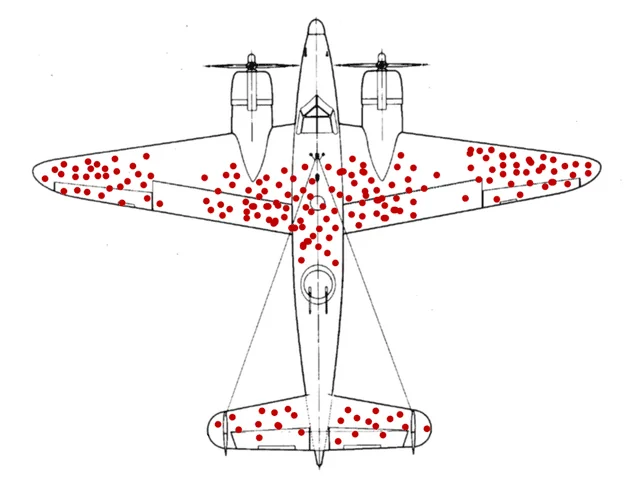
An accessible example of the danger of mistaken conclusions and cognitive bias in analysis is the Survivorship Bias. The term is primarily associated with the statistical work of Allied engineers during the Second World War: they analyzed the hits on aircraft returning from an operation and, after collecting sufficient data, proposed to reinforce the armor at these points..
However, the additional armoring did not increase the survival rate. The statisticians fell victim to cognitive bias: The actual information they had gained from their analysis was “At what points can an aircraft be severely damaged and still remain airworthy”. But this information was misinterpreted as “At what points are aircraft hit the most”.
Only the mathematician Abraham Wald revealed the fallacy by pointing out that this data set only took into account returned aircraft. His recommendation for action was thus exactly the opposite: He suggested that the aircraft should be armored where there was the least or no damage. His conclusion was that hits at these locations lead to the loss of the aircraft and thus to their absence as corrective in the data set. His work is now available for download here for those interested in statistics. A further insight is given in the article “The Legend of Abraham Wald” of the American Mathematical Society.
Diagnostic Analytics has the goal to answer the question “Why did it happen?” as well as possible
Where the core task of descriptive analysis is the preparation of data in clear structures enriched with relevant context, diagnostic analysis has the task of establishing the most conclusive relationships possible between the states of a system and their causes by interpretation. In the case of a coffee machine this is simple: The object “Draw coffee” reduces the filling level of the collection and grounds container. Descriptive analysis can quickly determine that the “water container empty” state always occurs after a certain number of draws. A connection between the empty water container and the absence of a fresh coffee is quickly established in this case. While the handling of the second most important tool of most developers boils down to fill level management, intralogistics is also concerned with the utilization of conveyors, travel times, available packing places and many other parameters.
Complex correlation is the central challenge of diagnostic analysis
A simple condition such as “the shelf space is empty” can require complex chains of explanation in intralogistics, which in turn depend on variable conditions. The goal of the diagnostic analysis is to find the most comprehensive and, above all, robust explanatory models based on logical links between the states measured by descriptive analysis.
Thus, the more often an assumption proves to be correct and is verified in the present data, the more valuable it is in the diagnostic analysis. The other important parameters are context and correlation because this is how causes are separated from accompanying symptoms and prioritized according to importance.
For example, a delayed departure due to bottlenecks in materials handling technology is more important than a delay due to bad weather. The company’s ability to act on the identified problem determines its prioritization in the analysis process. Therefore, the research branch “bad weather” starts from the beginning with fewer resources and is completed earlier, while the branch “bottlenecks in materials handling technology” is analyzed in detail.
How diagnostic analysis can be used in intralogistics
The central task of the diagnostic analysis is to provide the correct contextual information for the individual intralogistics key figures. For the analysis, it is important to ask detailed questions and criteria (e.g. how the part is packed or whether it has a high weight
), because it is an important factor in the analysis whether it is the first pick of 100 or that of a single part or whether, for example, a windshield or a small part is picked. The freely selectable granularity is decisive for the quality of the analysis since further patterns can be detected depending on the depth of observation.
The relevant objects are in most cases the following:
- Collection
- Order
- Inventory
- Pick
- Transport
- Package
- Shipping unit
The diagnostic analysis enables the central logistic objects to be enriched with relevant, stakeholder-based context and conclusions about occurring situations in the distribution center or warehouse to be drawn.
To the article overview
To our TUP series KI
Back to the home page
Source teaser image: Burak K

