In our Analytics series, we have already taken a look at the different tiers of analytics. With the TUP Hands-on Analytics series, our goal is to provide insight into specific scenarios and the available tools.
Quality assurance of existing data

As soon as it is ensured that all necessary data are available and comprehensive, the proper analytical methods can be used.
The first strategic overview of the order situation
Before starting with the in-depth work, such as route optimization for picks, an overall perspective of either the individual warehouse or the entire company is an indispensable basis. The usual metrics for this are:
- Orders
- Items
- Picks
An excerpt of the matching dimensions or contexts:
- Warehouse
- Customer
- Country
- Shipping service provider
When these metrics and dimensions are appropriately combined with time periods, an initial picture emerges on the basis of which initial conclusions can be drawn: Are there peaks or dips, or is everything consistent throughout the year. The more dynamic the ordering behavior, the more effort should be put into the explanatory models to clearly separate causality from correlation.

The standard tools for analysis
In addition to the strategic overview at warehouse or company level, there are a number of standard tools that can be used to take a first step into a more detailed analysis.
Analysis of the order structure
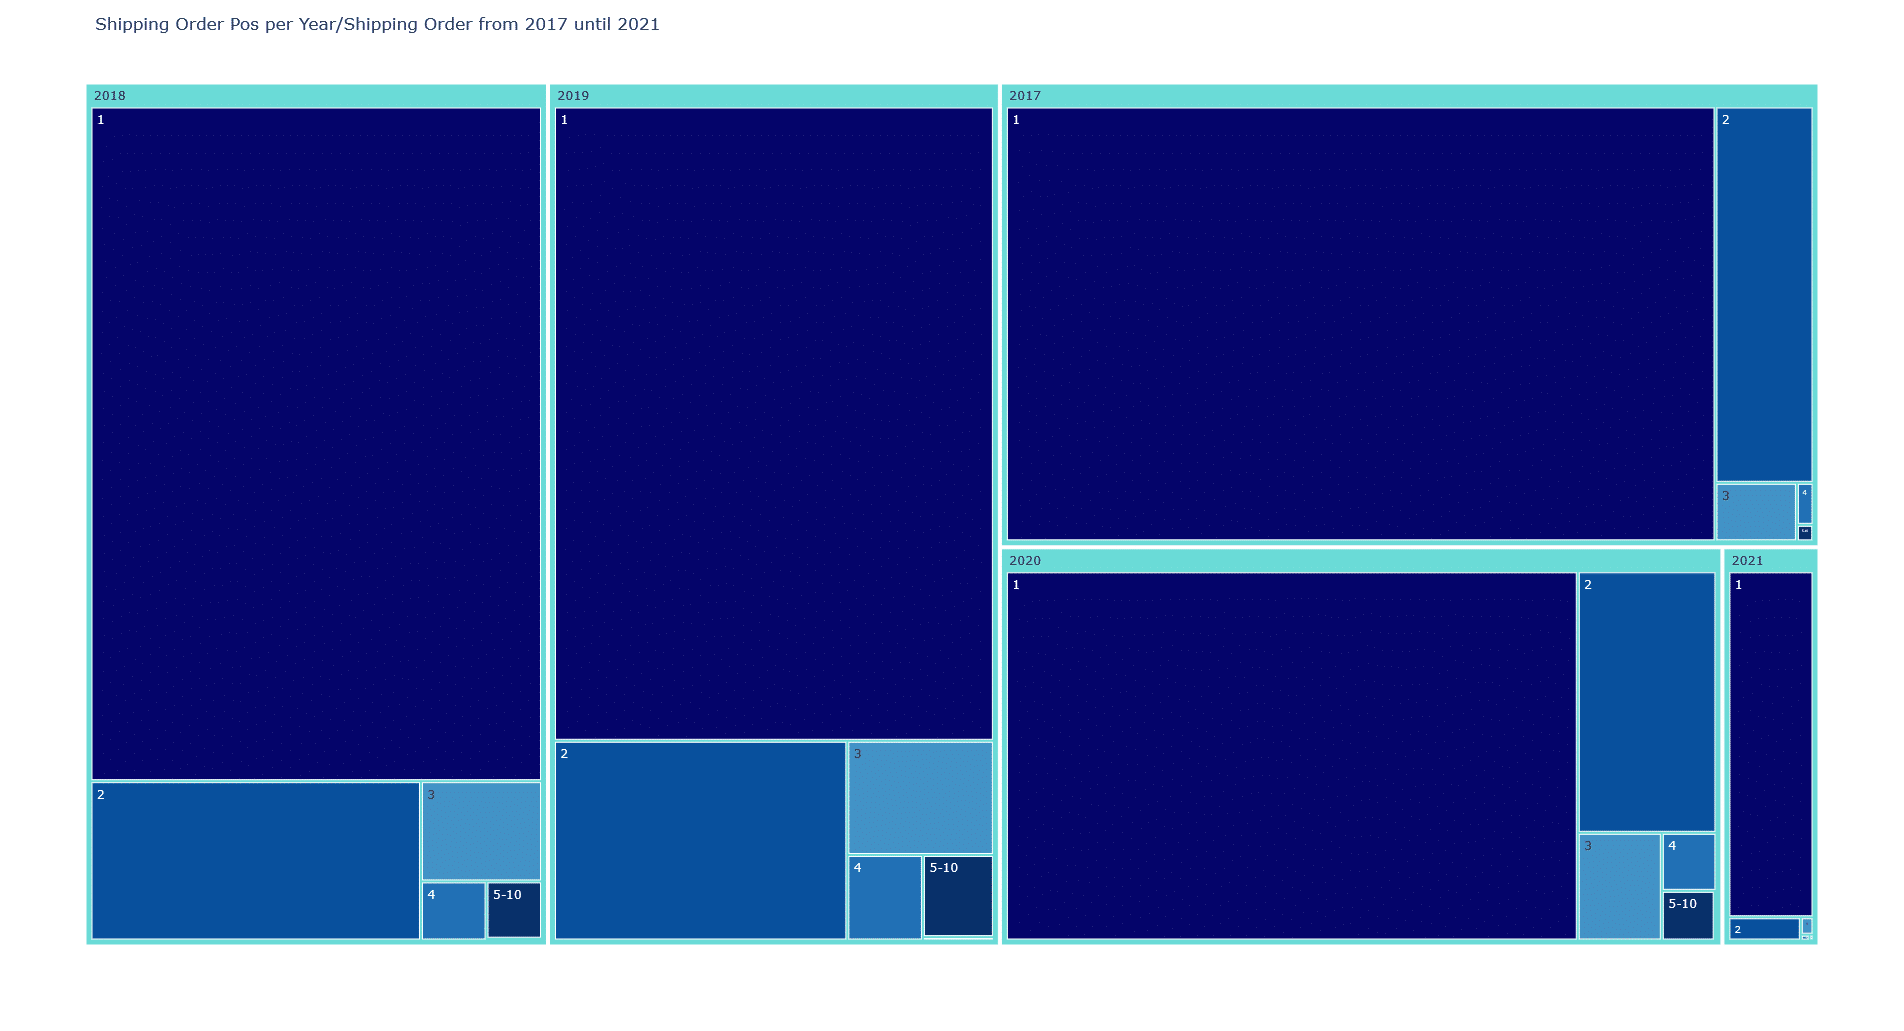
A view of the order structure over weekly, monthly and yearly periods in which the positions as well as the quantity of ordered articles are viewed. In this way, it is possible to quickly identify whether, for example, many orders contain only one item. Particularly in manually organized warehouses, such orders can quickly lead to processing bottlenecks and a lack of resources, as they often have a very poor cost-benefit ratio. This results in optimization potentials through clustering, optimization of routes or automation solutions to which such orders are offloaded.
Process duration at a glance and in segments
The duration of the overall process and the individual steps is an important indicator, especially with regard to the comparison of sites. A relevant parameter here is the number of 0-minute tours. These are picks in which the first and last picks of an aisle coincide. If this number is particularly high, it is an indicator that there is potential for optimization by changing the tours or the warehouse structure.
ABC and XYZ analysis
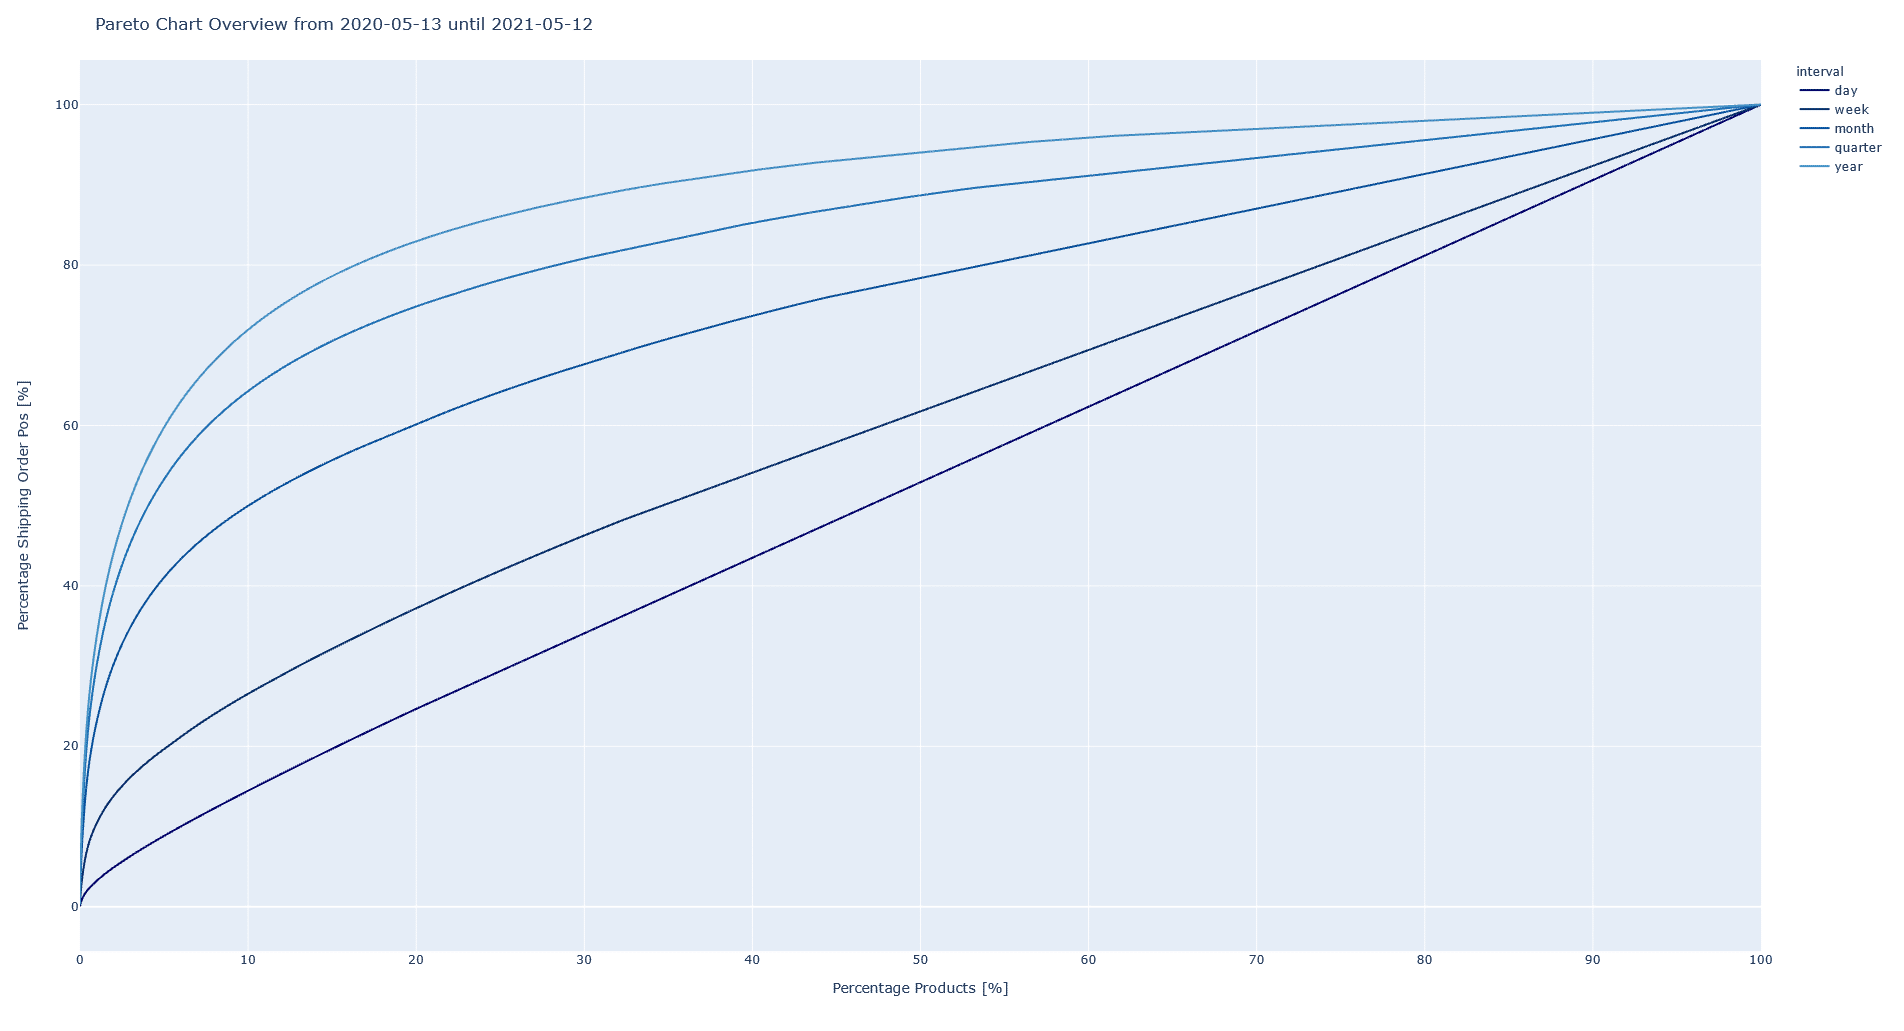
Classical ABC/XYZ analyses are often combined, since only one ABC or only one XYZ analysis offers insufficient information. A-articles have usually a value portion of 80% in the annual shipping value and thus represent a significant part of the profit. B-items have a value of only 15-20%. C-items even have only 5-10%.
What is not clear from this information, however, is the regularity with which the item is needed. This shortcoming is compensated by the XYZ analysis. An X-item is characterized by constant demand and no or only minor fluctuations. A Y-article is subject to fluctuations, which in most cases can be attributed to trends or seasonal demand. A Z-article, on the other hand, is subject to a high degree of irregularity, which cannot be traced or can only be traced to a small extent.
Picks in relation to aisles
The evaluation of the number of aisles approached per picking tour provides information about picking efficiency in the warehouse. Many approached lanes and few picks indicate optimization potentials.

Optimization potential for many orders with only one order position

Instead of the regular picking process, for example, single-piece items with an order quantity of 1 can be picked in a separate picking round and then transferred to a sorter to reduce the workload and increase the processing speed. Since it is clear that the items all need to be packed separately and each shipped to their customers.
Correct parameterization as a linchpin
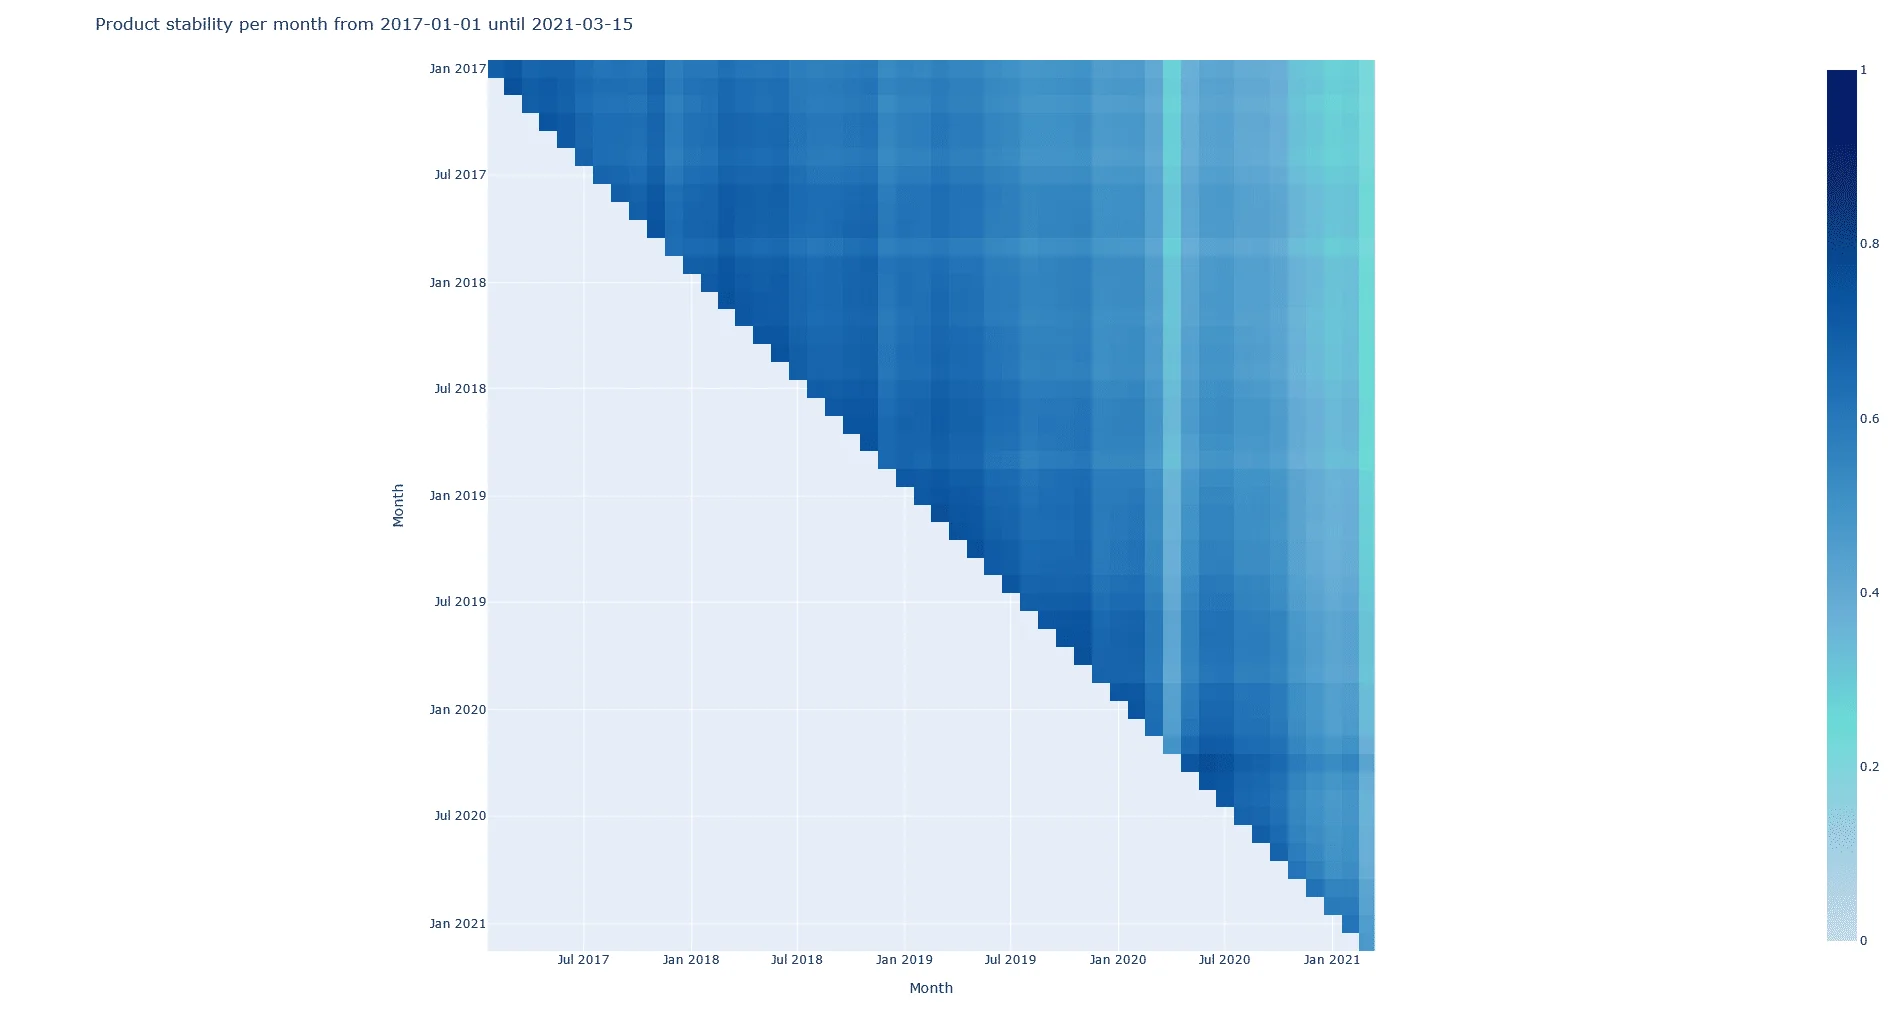
A decisive influence on the weighting of the values is the strategic objective, especially in the case of product stability. For example, should large or small clusters be identified in the warehouse, which often depends on the conditions on site. In a small warehouse, with little space for material movement, it may be worthwhile to create many small clusters instead of a few large ones. In this way, it can be ensured that only products that have a very high probability of being purchased regularly and together with other products are stored in clusters. It is therefore a good idea to start with broad parameters and then define narrower ones in small steps. In this way, it is possible to see in the diagrams whether there is a tipping point between large and small clusters, for example.
In the second part of the series, we apply the elements presented here in an exemplary analysis process to two hypothetical companies, one of which has a seasonal product range and the other a broad one that remains quite stable in terms of the products offered over the years.
