Logistics control center
Management-essential information visually enhanced in real-time
Every warehouse is as individual as the company that operates it. Our visualization solution for your logistics control center provides you with your key figures, not generic ones.
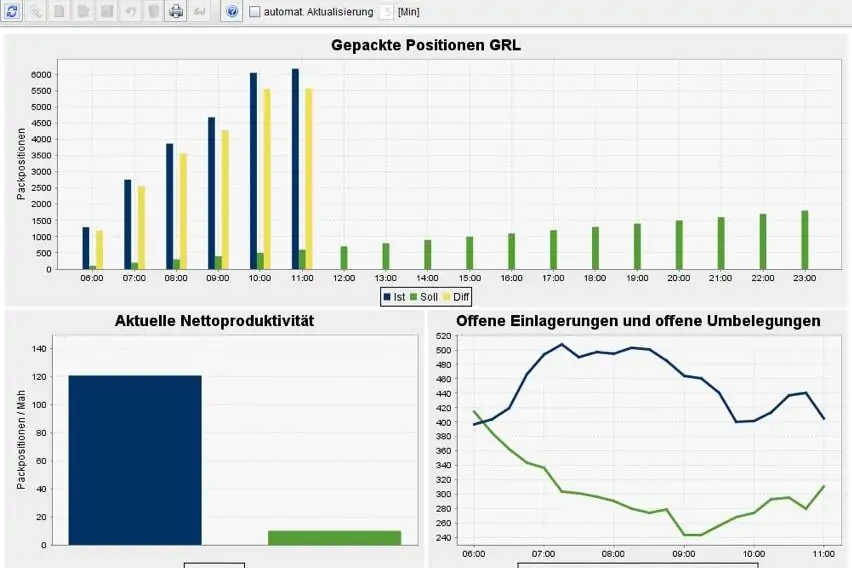
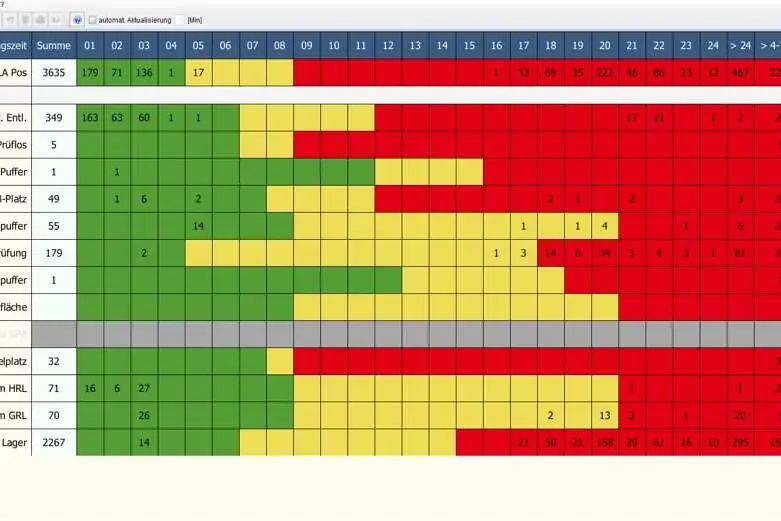
Synchronize time, personnel and machines order-related and in real-time to act proactively during the day’s workload instead of reacting to bottlenecks. Detailed graphical displays provide your employees with a comprehensive overview of current processes and capacity utilization as well as suggested solutions for complicated incoming orders.
software follows function
Use the full potential of key data visualization
All industry-standard solutions can display the transportation of inventory from A to B and the associated data.
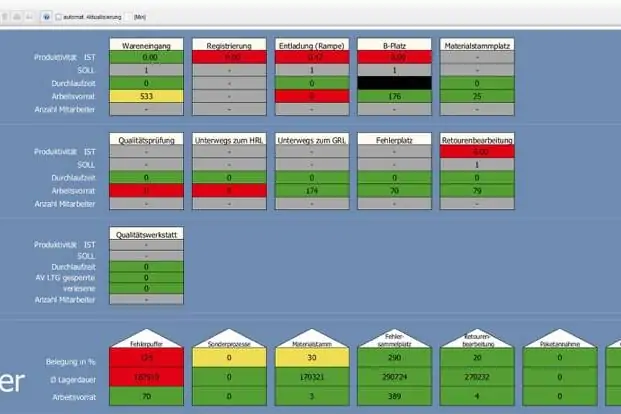
The key to the full potential of a control center is to visualize the data in real-time, embed it in the right context, derive recommendations for action and offer historical information for comparison.
Every warehouse is individual, so it also needs individual adaptation of key figures, user interfaces and process representations.
In modern logistics centers, the control center is the central instrument for managing the complex day-to-day business. Resources must be assigned or reprioritized. Organizational measures must be implemented before bottlenecks occur, and the right conclusions must be drawn quickly from the diverse data.
This is why our ‘Warehouse Logistics Dashboard’ is not only directly connected to the warehouse management system, but can also extract the data in real-time if required and display it separately.
This gives key process stakeholders access to the data without impeding decision-making processes.
Your advantages
The logistics control center at a glance
- Throughput and resource utilization are optimized
- Clear graphical presentation of all data
- Comprehensive process overview, progress monitoring, handling (picking or splitting orders) and performance overview (throughput per aisle, employees per aisle)
- Optimum transparency in the warehouse
- Possibility of customized selection of key figures for improved controlling and data for weak point analysis
- Ergonomic, intuitive user interface
logistics dashboard
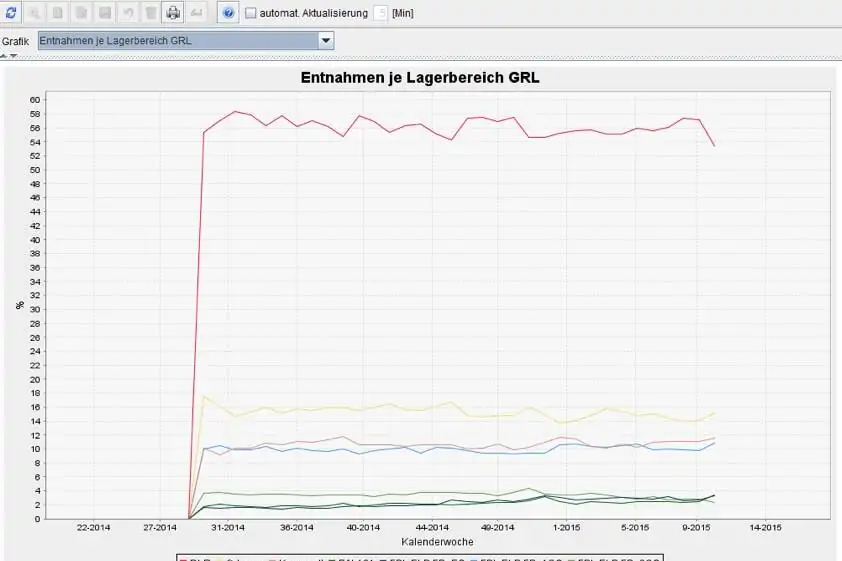
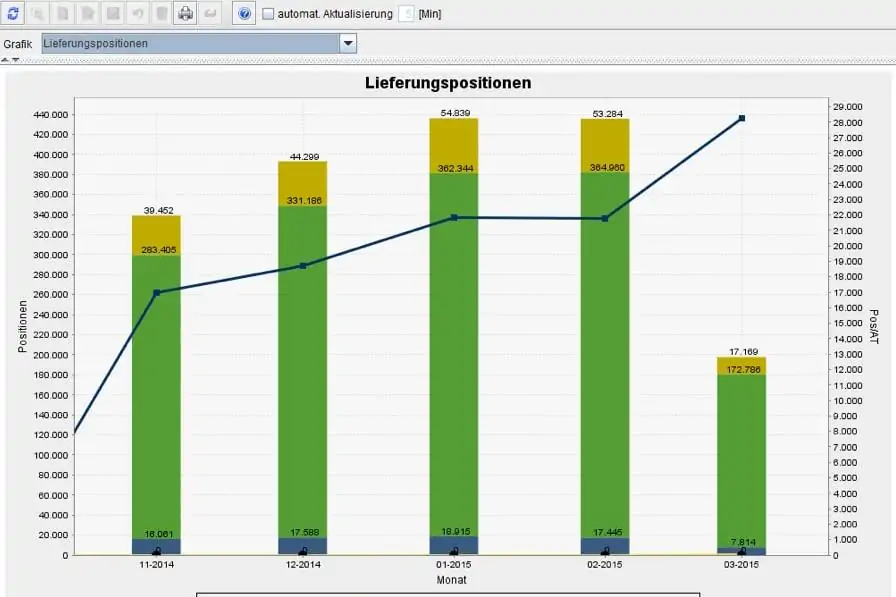
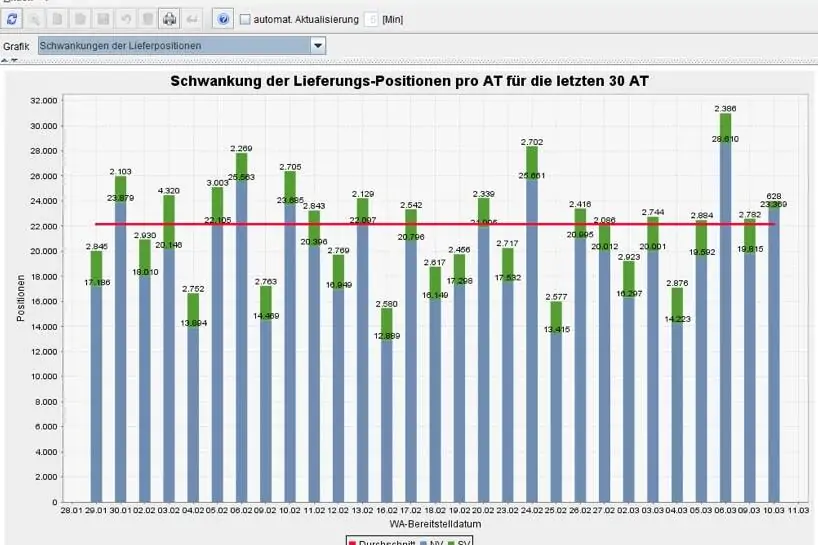
Graphical user interface - Galerie
Reach calculation
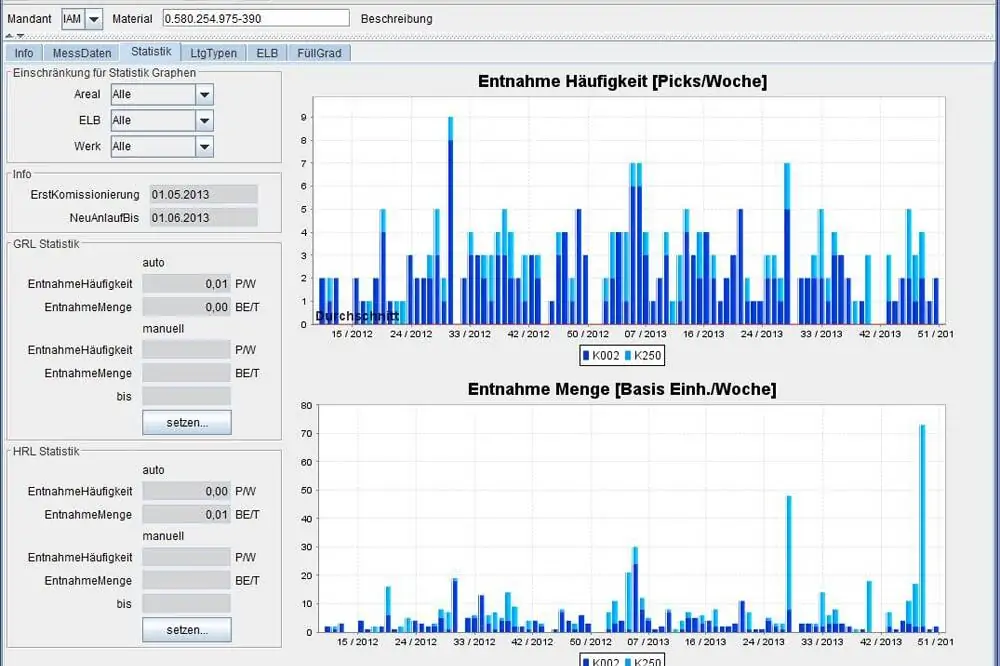
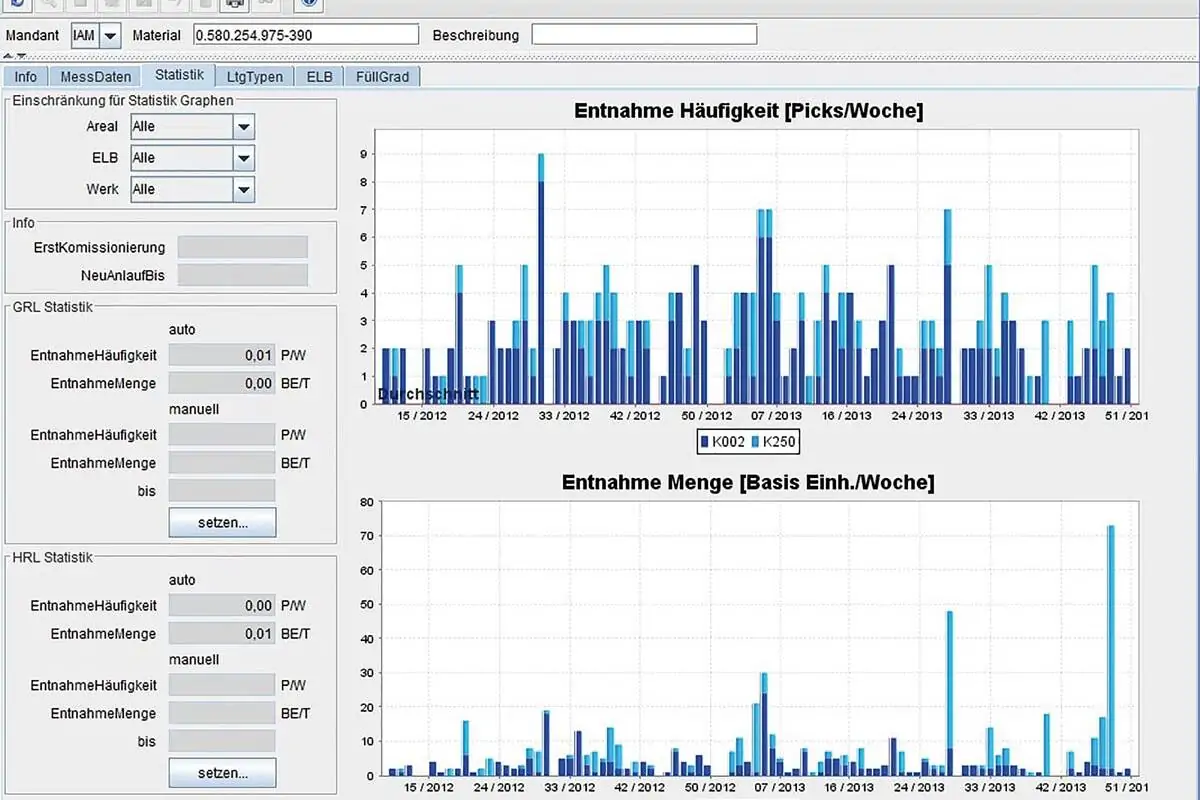
Does the warehouse rely on a high goods rotation or are items in stock longer than expected? Based on the cumulative values, the employee is able to determine where in the warehouse a fast-moving item or a slow-moving item should be stored. The values also allow conclusions to be drawn about replenishment.

Future-proof, modular and optimized for your business processes
Particularly in the case of automated processes, a strong, individualized solution for the control center is needed. With it, your employees can manage the logistical process on a daily basis and, if necessary, intervene effectively. With clear and comprehensible parameters, our solution provides the necessary information and intervention options. You can expand our adaptive software to include a module for managing your industrial trucks: the forklift control center.
This allows you to route your forklifts optimally and receive real-time updates on order progress through documentation steps such as barcode scans, wireless transmissions or RFID tags. During initial integration, our control center software already includes all relevant key figures. We also adapt these individually to your business processes and store parameterized messages that provide the starting point for root cause analyses during operation.
Success Story
Development of the mail-order business in Haldensleben for OTTO-Versand
The OTTO project comprised several expansion stages. Over the course of these stages, the following services had to be mapped in the software: expansion of the high-bay warehouse from 600,000 to 1.2 million boxes, integration of a new supply sorter, conversion to three-shift operation, structural expansions, integration of technical systems from various manufacturers, and conversion of the communication between the controllers to TCP/IP coupling.
Feature Summary - TUP.WLD
TUP.WLD visualizes processes and optimization potentials. Derive benchmarks from your key figures and use them to proactively optimize your intralogistics.
Forklift Control Center
Use the jack-of-all-trades among industrial trucks even more efficiently with our forklift control system, which adapts to any warehouse topography. Real-time feedback, seamless order documentation and route-optimized management of available forklifts ensure greater throughput in your warehouse.
Order optimization
The available transport orders are automatically distributed to ensure short distances and rapid availability. If necessary, the assignment can also be done manually. This ensures that forklifts are utilized efficiently. You save resources, reduce distances traveled and prevent bottlenecks in your intralogistics processes. To provide your control center managers with the best possible support, we work with you to develop adjustable strategies for order processing.
Transparency and Verification
Thanks to order feedback at the storage location and the other stations of the transport protocol, you always have an overview of the order progress. For example, you can start defined follow-up processes such as replenishment or a prompt for a continuous inventory when the order reaches a zero crossing point. In addition to triggering follow-up processes, you also increase warehouse safety by verifying the goods to be transported.
Picking
All common picking methods are supported, whether paper-based or paperless. This means that you can continue to use your existing systems without any problems and are well prepared for the integration of up-to-date solutions.
A selection of the key performance indicators for your reporting
- Order structure in order type, size and number of picking items per order
- Picks per day and employee for premium wages
- Packing performance of employees
- Error rates
- Capacity and utilization of warehouse and storage equipment
- ABC statistics
- Warehouse filling level
- Throughput, summarized and per area
- Number and type of stock movements
- Stocks and stock changes
- Supplier quality and number of clarification cases
- Order throughput time
- Storage loss and stockouts
- Space and area utilization rate
- Picking rate and costs per order
- Stock movements, capacity utilization and costs per stock movement
- Rate of returns and reasons for returns
Do you have any questions?
